
nRide Driver Incentive Simulation – Simplified
Focus on token rewards and voting power ratios between drivers
Simulation Parameters
Voting Power Distribution
Token Holdings and Voting Power
Driver Details
Driver | Type | nRide Tokens | Voting Power (%) | Rides per day | Earnings Ratio |
---|
How This Works
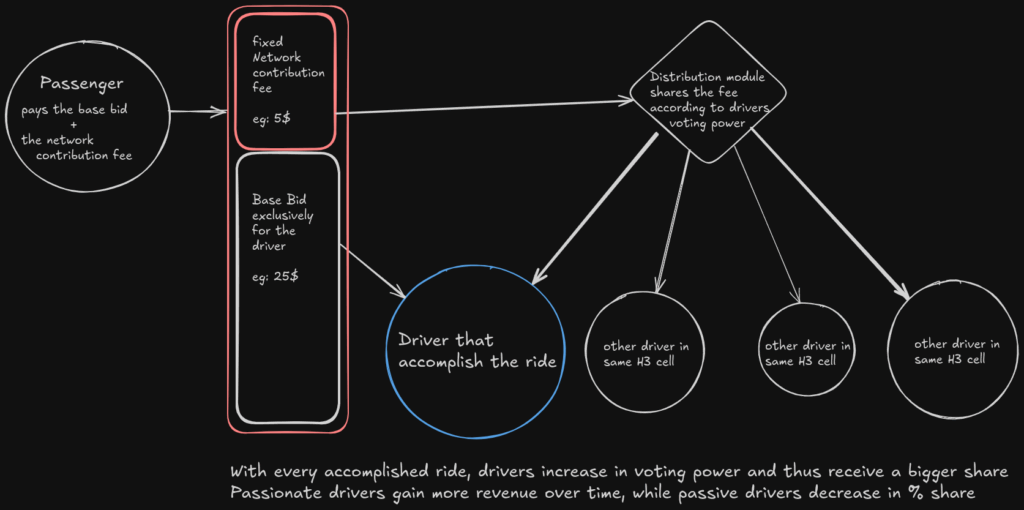
This simulation demonstrates how token rewards for active drivers impact voting power distribution over time:
- All drivers start with 1 token in round 1
- Active drivers complete rides and earn token rewards for each ride
- Passive drivers don’t complete rides and don’t earn token rewards
- Voting power is determined by token holdings (1 token = 1 vote)
- Earnings are distributed proportionally to voting power
Multi-Round Simulation
- Each round represents a period of time (e.g., a day or week)
- Active drivers complete their set number of rides each round
- Each ride earns the driver token rewards (adjustable per ride)
- As drivers accumulate tokens, their voting power increases
- Each round uses the recent token balance for distribution calculation
Key Insights
- Active drivers can adjust their number of rides using the + and – buttons
- Drivers who complete more rides earn more tokens over time
- Token rewards create a feedback loop: more rides → more tokens → more voting power → more earnings
- The simulation focuses on the ratios between drivers, not absolute values
Conclusion and explainantion
# nRide Token Rewards System: Logic and Examples
## Core Concept
The nRide token rewards system is designed to incentivize active driver participation while ensuring all stakeholders maintain voting power proportional to their contributions to the network.
### Key Principles
1. **Token = Voting Power**: Each token represents one vote in the network
2. **Equal Starting Point**: All drivers begin with 1 token each
3. **Activity Rewards**: Active drivers earn tokens for completing rides
4. **Passive Participation**: Passive drivers don't earn new tokens but maintain their initial tokens
5. **Proportional Distribution**: Earnings are distributed proportionally to voting power
## How the System Works
### Token Accumulation
1. **Initial State**: Each driver (active or passive) starts with 1 token
2. **Token Rewards**: Active drivers earn tokens for each ride they complete
3. **Voting Power Calculation**: A driver's voting power percentage = (driver's tokens / total tokens) × 100
4. **Earnings Distribution**: Earnings are distributed according to voting power percentages
### Multi-Round Simulation
The system evolves over multiple rounds (days):
- Each round, active drivers complete their rides and earn token rewards
- Token balances accumulate over time
- Voting power percentages are recalculated after each round
- The distribution of earnings shifts as voting power changes
## Simple Examples
### Example 1: Equal Activity (1 ride per day)
**Initial State (Day 0):**
- Active Driver A: 1 token, 33.3% voting power, 1 ride per day
- Active Driver B: 1 token, 33.3% voting power, 1 ride per day
- Passive Driver C: 1 token, 33.3% voting power, 0 rides
**After Day 1:**
- Active Driver A: 2 tokens (1 initial + 1 earned), 40% voting power
- Active Driver B: 2 tokens (1 initial + 1 earned), 40% voting power
- Passive Driver C: 1 token (unchanged), 20% voting power
**After Day 5:**
- Active Driver A: 6 tokens (1 initial + 5 earned), 46.2% voting power
- Active Driver B: 6 tokens (1 initial + 5 earned), 46.2% voting power
- Passive Driver C: 1 token (unchanged), 7.6% voting power
### Example 2: Different Activity Levels (Default Simulation)
**Initial State (Day 0):**
- Active Driver A: 1 token, 33.3% voting power, 3 rides per day
- Active Driver B: 1 token, 33.3% voting power, 2 rides per day
- Passive Driver C: 1 token, 33.3% voting power, 0 rides
**After Day 1:**
- Active Driver A: 4 tokens (1 initial + 3 earned), 57.1% voting power
- Active Driver B: 3 tokens (1 initial + 2 earned), 42.9% voting power
- Passive Driver C: 1 token (unchanged), 12.5% voting power
**After Day 5:**
- Active Driver A: 16 tokens (1 initial + 15 earned), 57.1% voting power
- Active Driver B: 11 tokens (1 initial + 10 earned), 39.3% voting power
- Passive Driver C: 1 token (unchanged), 3.6% voting power
## Key Insights
1. **Active Participation Advantage**: Active drivers gain increasing voting power over time
2. **Activity Level Impact**: Drivers who complete more rides per day gain voting power faster
3. **Passive Dilution**: Passive drivers see their voting power percentage decrease over time
4. **Feedback Loop**: More rides → more tokens → more voting power → more earnings → more incentive to be active
5. **Long-term Equilibrium**: The system naturally rewards consistent participation
## Mathematical Formula
For any driver after n rounds:
```
Voting Power % = (Initial Tokens + (Rides per Day × Tokens per Ride × n)) / Total Tokens × 100
```
Where:
- Initial Tokens = Starting token balance (typically 1)
- Rides per Day = Number of rides the driver completes each day
- Tokens per Ride = Token reward for each completed ride
- n = Number of days/rounds
- Total Tokens = Sum of all tokens held by all drivers
## Practical Applications
1. **Driver Incentivization**: The system encourages consistent activity and participation
2. **Governance Alignment**: Voting power naturally shifts toward the most active contributors
3. **Passive Investment**: Passive drivers maintain some voting power but see it diluted over time
4. **Meritocratic Distribution**: Rewards are proportional to contribution
5. **Network Growth**: As more drivers join and become active, the network becomes more valuable
The simulation allows you to explore different scenarios by adjusting the number of drivers, rides per day, and simulation rounds to see how token rewards impact voting power distribution over time.
damn, looks like pandora's box
Personal note: A system like that can become unstable when it reaches its maxima on both sides, like: only a few drivers feed a big amount of passive drivers wouldn't work for long, and while the opposite; a set of rushing drivers could outpace all others in voting power...
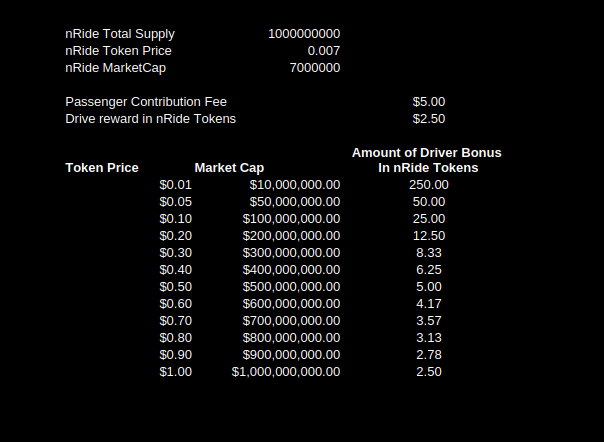
 Not sure how to handle this yet
# nRide Token Rewards System: Logic and Examples
## Core Concept
The nRide token rewards system is designed to incentivize active driver participation while ensuring all stakeholders maintain voting power proportional to their contributions to the network.
### Key Principles
1. **Token = Voting Power**: Each token represents one vote in the network
2. **Equal Starting Point**: All drivers begin with 1 token each
3. **Activity Rewards**: Active drivers earn tokens for completing rides
4. **Passive Participation**: Passive drivers don't earn new tokens but maintain their initial tokens
5. **Proportional Distribution**: Earnings are distributed proportionally to voting power
## How the System Works
### Token Accumulation
1. **Initial State**: Each driver (active or passive) starts with 1 token
2. **Token Rewards**: Active drivers earn tokens for each ride they complete
3. **Voting Power Calculation**: A driver's voting power percentage = (driver's tokens / total tokens) × 100
4. **Earnings Distribution**: Earnings are distributed according to voting power percentages
### Multi-Round Simulation
The system evolves over multiple rounds (days):
- Each round, active drivers complete their rides and earn token rewards
- Token balances accumulate over time
- Voting power percentages are recalculated after each round
- The distribution of earnings shifts as voting power changes
## Simple Examples
### Example 1: Equal Activity (1 ride per day)
**Initial State (Day 0):**
- Active Driver A: 1 token, 33.3% voting power, 1 ride per day
- Active Driver B: 1 token, 33.3% voting power, 1 ride per day
- Passive Driver C: 1 token, 33.3% voting power, 0 rides
**After Day 1:**
- Active Driver A: 2 tokens (1 initial + 1 earned), 40% voting power
- Active Driver B: 2 tokens (1 initial + 1 earned), 40% voting power
- Passive Driver C: 1 token (unchanged), 20% voting power
**After Day 5:**
- Active Driver A: 6 tokens (1 initial + 5 earned), 46.2% voting power
- Active Driver B: 6 tokens (1 initial + 5 earned), 46.2% voting power
- Passive Driver C: 1 token (unchanged), 7.6% voting power
### Example 2: Different Activity Levels (Default Simulation)
**Initial State (Day 0):**
- Active Driver A: 1 token, 33.3% voting power, 3 rides per day
- Active Driver B: 1 token, 33.3% voting power, 2 rides per day
- Passive Driver C: 1 token, 33.3% voting power, 0 rides
**After Day 1:**
- Active Driver A: 4 tokens (1 initial + 3 earned), 57.1% voting power
- Active Driver B: 3 tokens (1 initial + 2 earned), 42.9% voting power
- Passive Driver C: 1 token (unchanged), 12.5% voting power
**After Day 5:**
- Active Driver A: 16 tokens (1 initial + 15 earned), 57.1% voting power
- Active Driver B: 11 tokens (1 initial + 10 earned), 39.3% voting power
- Passive Driver C: 1 token (unchanged), 3.6% voting power
## Key Insights
1. **Active Participation Advantage**: Active drivers gain increasing voting power over time
2. **Activity Level Impact**: Drivers who complete more rides per day gain voting power faster
3. **Passive Dilution**: Passive drivers see their voting power percentage decrease over time
4. **Feedback Loop**: More rides → more tokens → more voting power → more earnings → more incentive to be active
5. **Long-term Equilibrium**: The system naturally rewards consistent participation
## Mathematical Formula
For any driver after n rounds:
```
Voting Power % = (Initial Tokens + (Rides per Day × Tokens per Ride × n)) / Total Tokens × 100
```
Where:
- Initial Tokens = Starting token balance (typically 1)
- Rides per Day = Number of rides the driver completes each day
- Tokens per Ride = Token reward for each completed ride
- n = Number of days/rounds
- Total Tokens = Sum of all tokens held by all drivers
## Practical Applications
1. **Driver Incentivization**: The system encourages consistent activity and participation
2. **Governance Alignment**: Voting power naturally shifts toward the most active contributors
3. **Passive Investment**: Passive drivers maintain some voting power but see it diluted over time
4. **Meritocratic Distribution**: Rewards are proportional to contribution
5. **Network Growth**: As more drivers join and become active, the network becomes more valuable
The simulation allows you to explore different scenarios by adjusting the number of drivers, rides per day, and simulation rounds to see how token rewards impact voting power distribution over time.