
Token Incentivized Physical Infrastructure Network
Network Participants that generate revenue to the network are rewarded with nRide Tokens from the DAO treasury.
Passionate Drivers increase their revenue with active network participation
Localized revenue distribution
Local markets share the Bonus and don’t interfere one another
The revenue is shared among those that bring value to the network
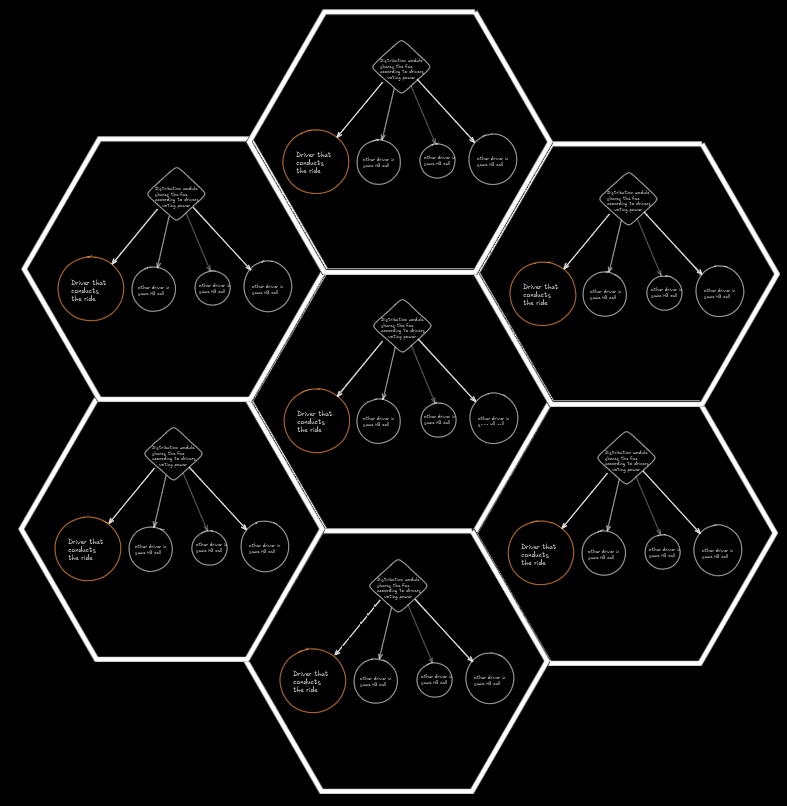
Equal distribution of the Bonus contribution among all Cell Stakers


Varying nRide Token distribution among network participants


Payment without intermediary
You earn more than you bid
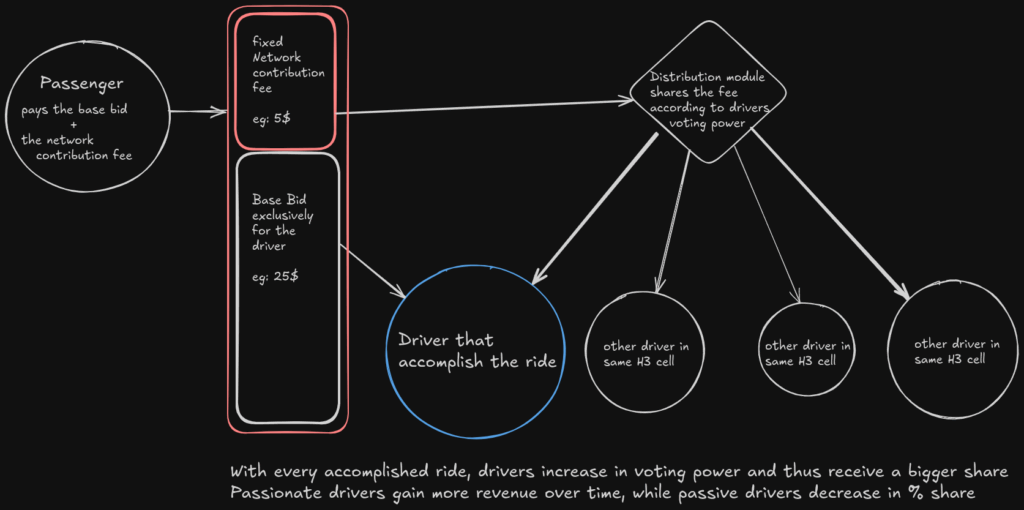
As an independent entrepreneur, you earn what you bid. A fixed network fee will be added on top of this offer and proposed to the passenger. After a successful ride, this additional network contribution fee will be distributed among all nRide stakeholders in that specific area, So the driver receives his initial bid and the partial reward on top.
Even drivers that are currently not on active duty earn their share of rewards, revenued from the active driver set.
Need to refactor to new page
See the Derivation
Seems like there is a glitch in the model, but a positive one: lets assume:
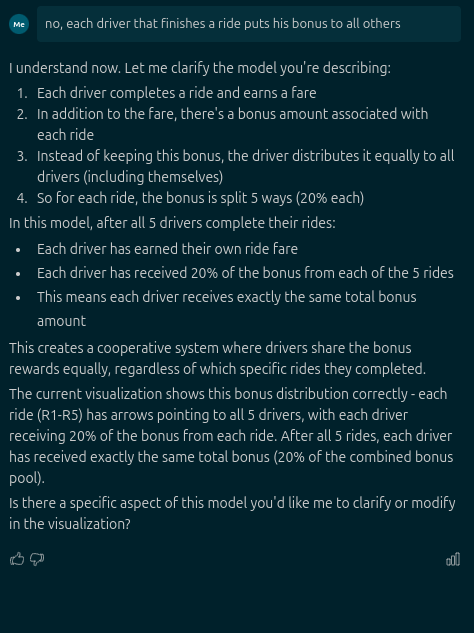
5 drivers in the cell, allholding the same amount of Tokens (for example 100), so the outcome would for each driver would be 20% of generated network fee. At first glance it seems, he would receive just a mere 20% of the On-Top Bonus
BUT: If all 5 drivers are active one by one, and each accomplishes a ride, while the other drivers also receive 20% exactly 5 times….
In the end each driver has done 1 ride, but received 5x 20% — so exactly the amount that has been added on top of his bid …?!?!?
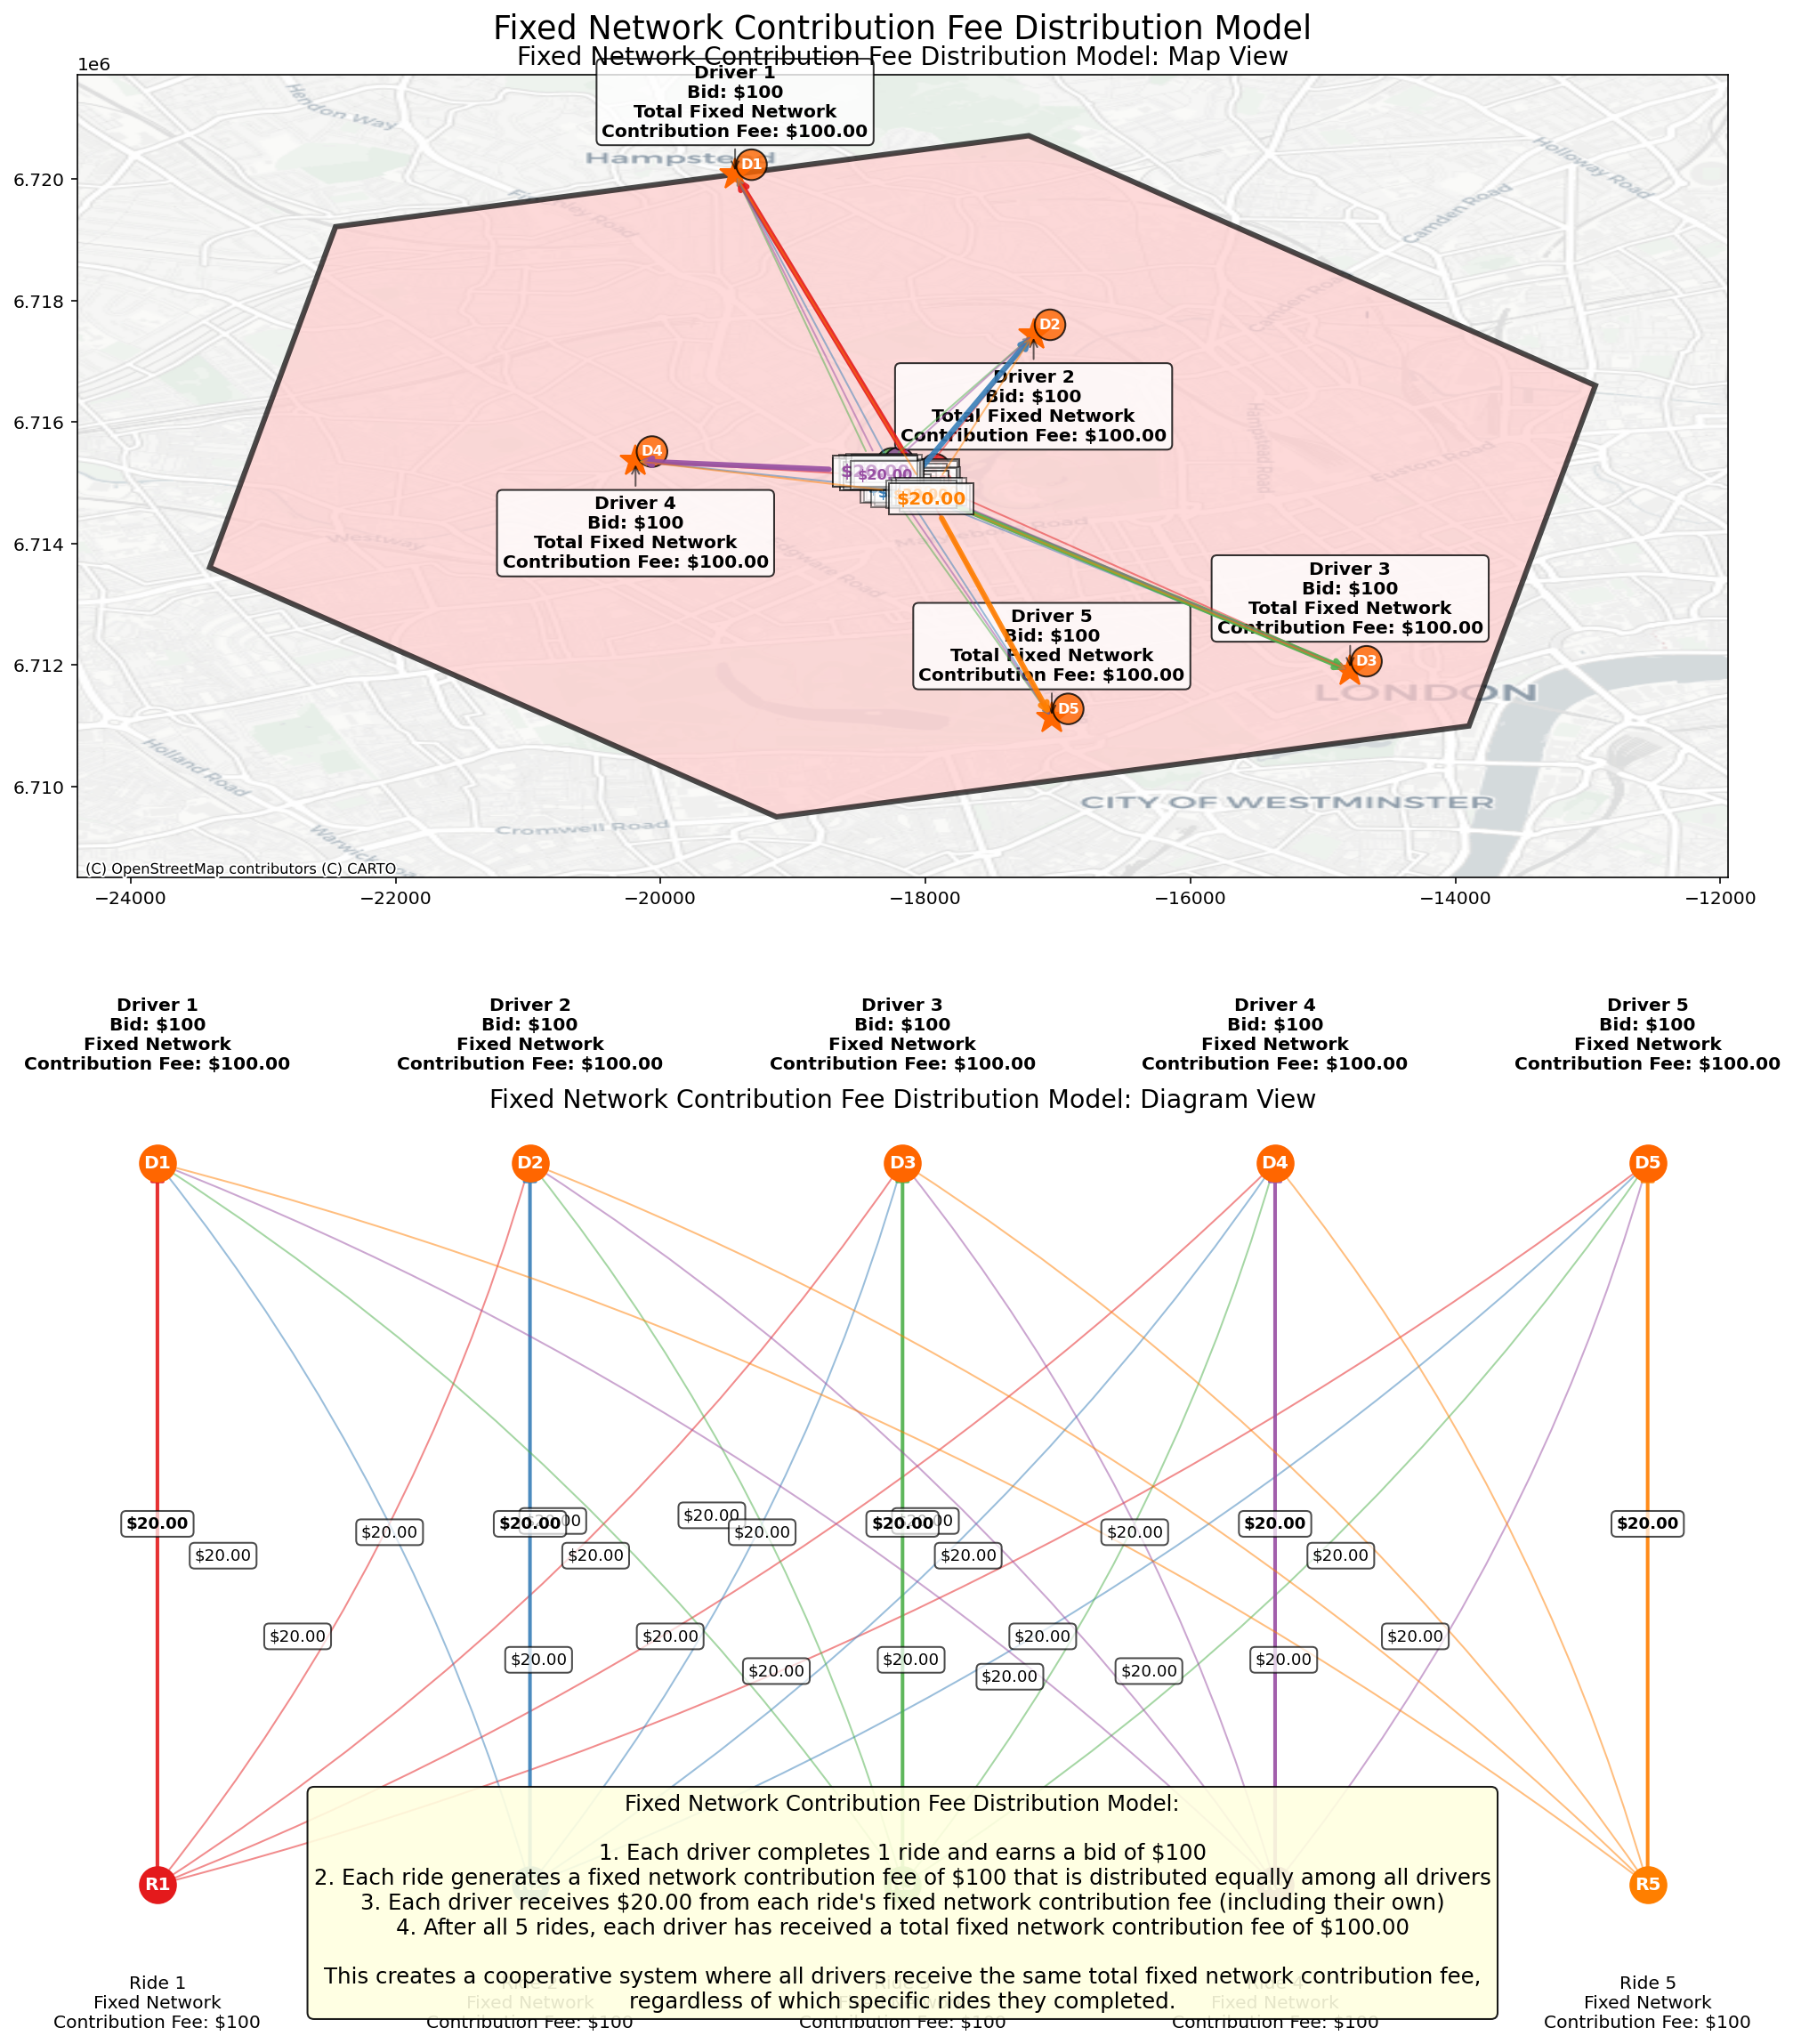
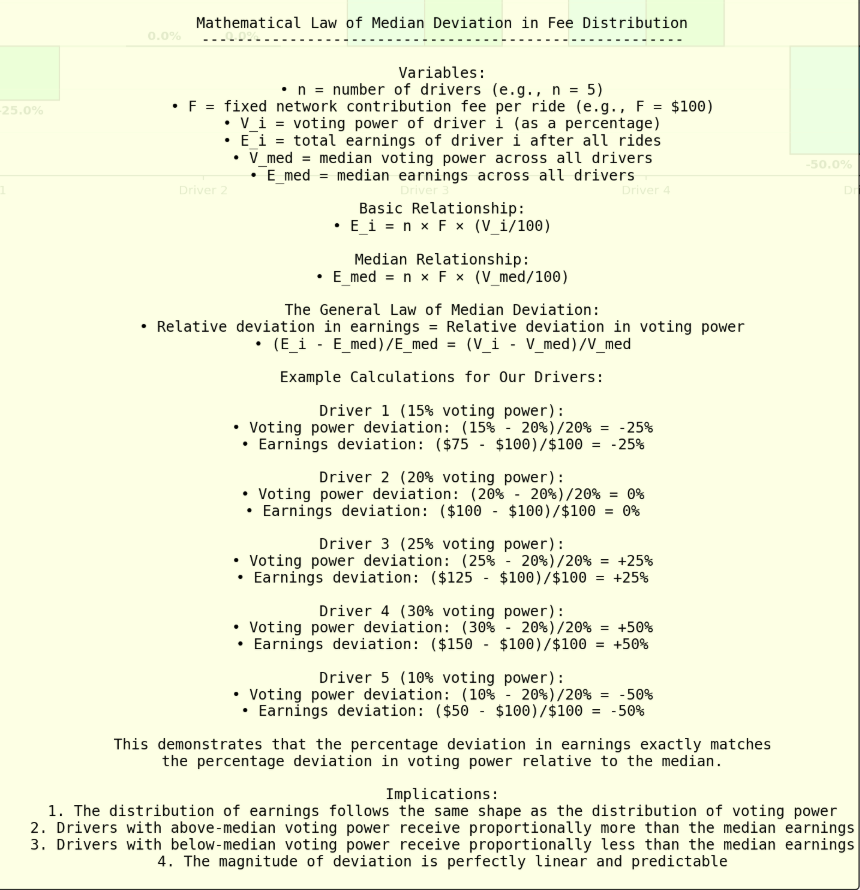
Thats the outcome with slightly varying voting powers:
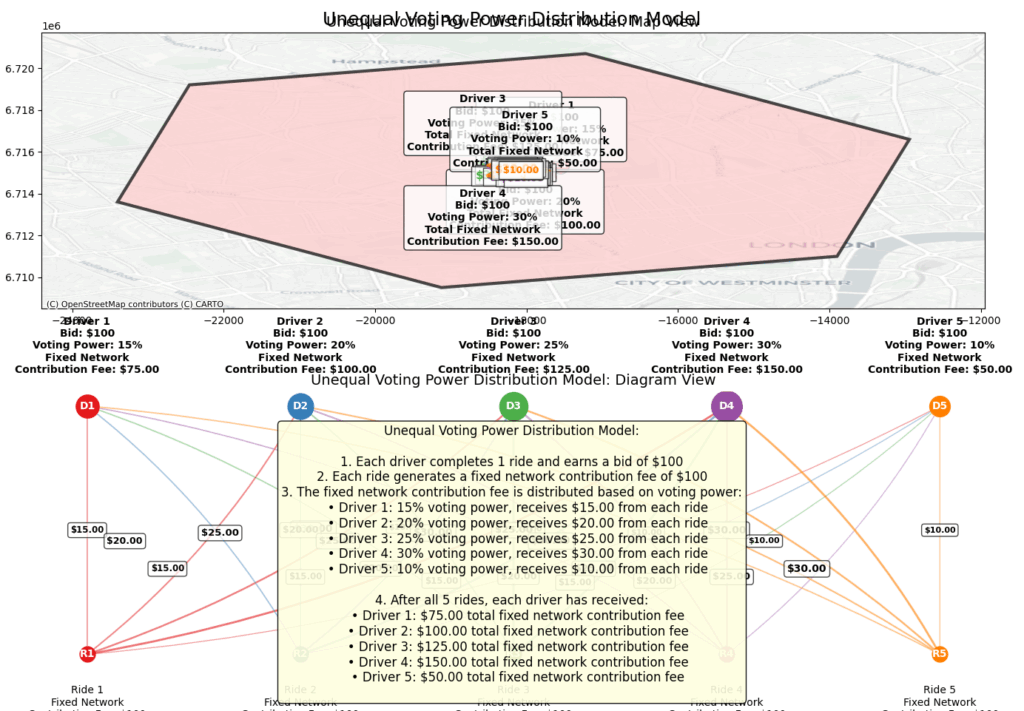
Seems the outcome calculates around the median …. have to get my math books i think…
So, here we go
Bruuh, after too much coffe my conclusion is: The set ain’t simply giving from one instance to multiple other instances, instead there are multiple generating instances revenueing each
Absolute $ values in these models are just for better readability, in reality a network contribution fee should be somewhere between 3$ and max. 10$
Drivers that have >50% of median voting power receive even more than this contribution fee, while drivers with <50% of cell median recieve less than this extra fee
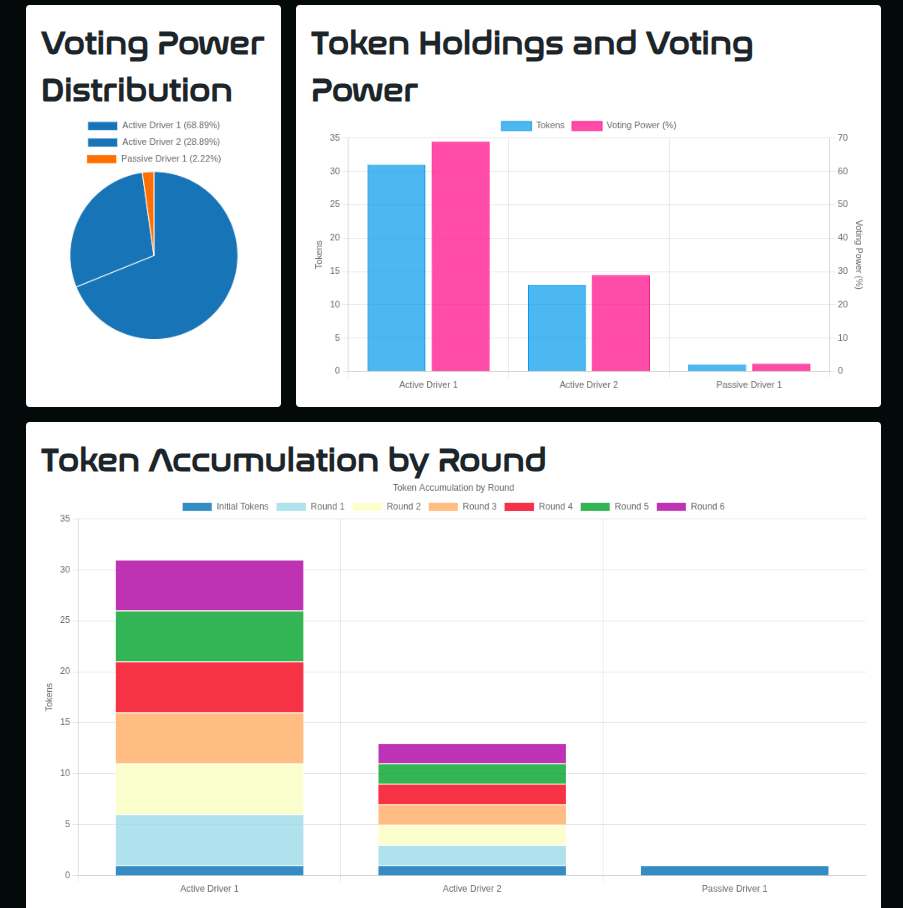
nRide Fee Distribution Simulator
Explore how voting power distribution affects rewards between active and passive drivers
Simulation Parameters
Individual Token Allocation
Earnings and Contributions
Individual Driver Details
How It Works
Key Concepts
-
Active vs. Passive Drivers:
- Active drivers complete rides and contribute fees to the network
- This fee is distributed amon network owners according to their staked nRide Token balance
- Passive drivers don’t complete rides but still receive earnings based on their voting power
-
Voting Power Distribution:
- The total voting power in the system is always 100%
- Drivers receive 1 nRide Token per accomplished ride and increase their share. They are also free to buy or sell tokens on the open market
- Each driver’s earnings are proportional to their voting power in the particular H3 cell.
-
Fee Distribution:
- Each active driver completes one ride, generating a fixed network contribution fee on top of his base bide
- Drivers that contribute to the system, are rewarded with a growing share of the total network contribution fee
- The system maintains conservation of fees: total fees generated = total fees distributed
Try adjusting the parameters to see how different scenarios affect the distribution of rewards!
The concept is pretty simple: Its an integral over time (in this case for example a day) that the earned fees (coming only from active drivers) are distributed to passive and active drivers according to their token holdings in that particular H3 cell. Actually the nRide Token is simply the distribution key, how the network contribution fee is being shared among network participants.
To reward those ones that bring in value, check this simulation that iterates changing token distribution over time as active drivers increase their holdings with every ride they accomplish.
A more comprehensive approach can be found in the simulation tab, to model token balance change over time

Document draft
This whitepaper presents the nRide Network Rewards Model, a geospatial staking system built on the H3 hierarchical hexagonal grid. The model creates a balanced ecosystem where network participants can stake tokens to receive a share of network rewards generated within specific geographic areas. The system is designed to incentivize both granular local coverage by drivers and broad regional coverage by investors, creating a sustainable and scalable ride-sharing network.
## Table of Contents
1. [Introduction](#introduction)
2. [The H3 Hierarchical Hexagonal Grid](#the-h3-hierarchical-hexagonal-grid)
3. [Staking Mechanics](#staking-mechanics)
4. [Reward Distribution Mathematics](#reward-distribution-mathematics)
5. [Stakeholder Strategies](#stakeholder-strategies)
6. [Real-World Scenarios](#real-world-scenarios)
7. [Economic Implications](#economic-implications)
8. [Technical Implementation](#technical-implementation)
9. [Conclusion](#conclusion)
## 1. Introduction
nRide is a decentralized ride-sharing platform that distributes network rewards to stakeholders based on their token stake and geographic coverage. Unlike traditional ride-sharing platforms where a central company captures most of the value, nRide distributes network rewards to token holders who have staked in the geographic areas where rides occur.
The core innovation of the nRide Network Rewards Model is the use of the H3 hierarchical hexagonal grid to create a geospatial staking system that:
– Allows precise geographic targeting of stake
– Creates natural incentives for optimal coverage
– Balances the interests of different stakeholder types
– Provides passive income opportunities for network participants
– Scales efficiently across cities, regions, and countries
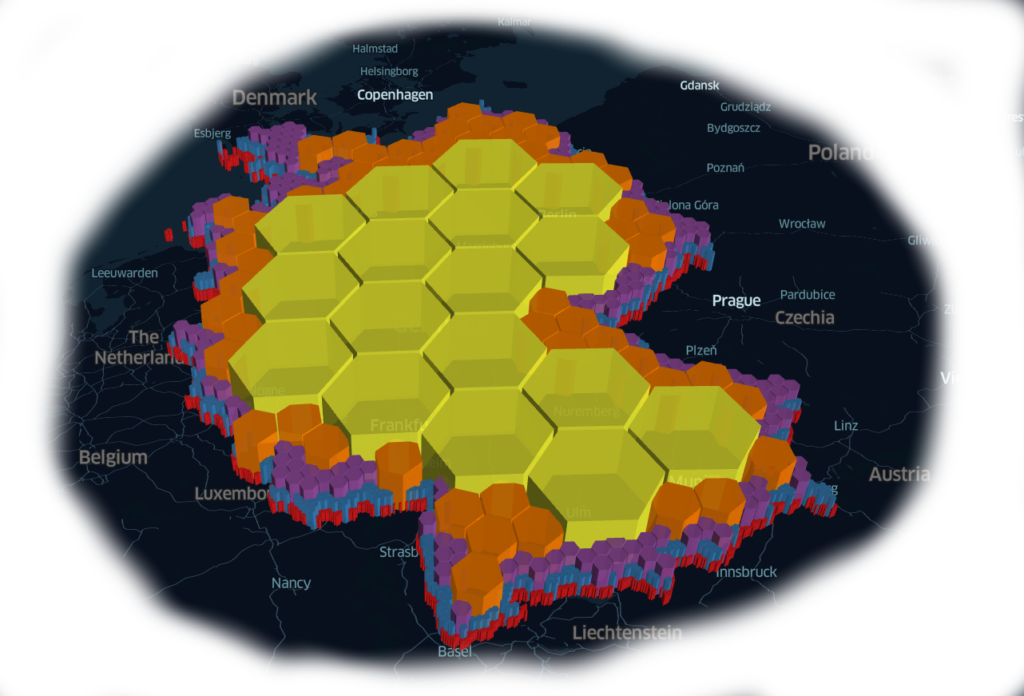
## 2. The H3 Hierarchical Hexagonal Grid
### 2.1 What is H3?
H3 is a geospatial indexing system developed by Uber that divides the world into hexagonal cells at different resolutions. Each resolution level divides parent cells into approximately 7 smaller child cells, creating a hierarchical structure.
### 2.2 H3 Resolution Levels
The nRide model primarily uses two resolution levels:
– **Regional Level (Resolution 5)**: Covers approximately 252.9 km² per cell
– **District Level (Resolution 6)**: Covers approximately 36.13 km² per cell
Each Regional cell contains exactly 7 District cells. This hierarchical relationship is fundamental to the staking power calculations in our model.
### 2.3 Why Hexagons?
Hexagonal grids offer several advantages over traditional square grids:
– Uniform adjacency (each cell has exactly 6 neighbors)
– More circular shape (minimizes distortion from center to edge)
– Better representation of natural movement patterns
– Smoother transitions between resolution levels
## 3. Staking Mechanics
### 3.1 Basic Staking Principles
In the nRide system, token holders can stake their tokens in specific H3 cells at different resolution levels:
– **District Staking**: Staking at Resolution 6 (smaller, more precise areas)
– **Regional Staking**: Staking at Resolution 5 (larger areas covering multiple districts)
When network activity (rides) occurs within a cell, the generated network rewards are distributed proportionally among all stakeholders with effective stake in that cell.
### 3.2 Effective Staking Power
A key principle of the model is that staking at higher resolution (smaller cells) grants full staking power, while staking at lower resolution (larger cells) results in reduced effective staking power:
– **District Stake**: 100% effective (1:1 ratio)
– **Regional Stake**: 1/7 effective (1:7 ratio)
This creates a natural incentive to stake in smaller, more precise areas while still allowing for broader coverage through regional staking.
## 4. Reward Distribution Mathematics
### 4.1 Effective Stake Calculation
For any given H3 cell at the District level (Resolution 6), the effective stake is calculated as:
“`
Effective_Stake_District = Actual_Stake_District
Effective_Stake_Region = Actual_Stake_Region / 7
Total_Effective_Stake = Sum(Effective_Stake_District) + Sum(Effective_Stake_Region)
“`
### 4.2 Reward Share Formula
When a network reward is generated in a District cell, each stakeholder receives a proportion based on their effective stake:
“`
Stakeholder_Reward_Percentage = (Stakeholder_Effective_Stake / Total_Effective_Stake) * 100%
“`
### 4.3 Mathematical Example
Consider a District cell with the following stakes:
– District Stakeholder 1: 75 tokens
– District Stakeholder 2: 25 tokens
– Regional Stakeholder: 250 tokens (covering the parent Regional cell)
The effective stakes would be:
– District Stakeholder 1: 75 tokens (full power)
– District Stakeholder 2: 25 tokens (full power)
– Regional Stakeholder: 250/7 = 35.7 tokens (1/7 power)
Total Effective Stake: 75 + 25 + 35.7 = 135.7 tokens
Reward distribution for a 100 USDC network reward:
– District Stakeholder 1: (75/135.7) * 100 = 55.27 USDC (55.27%)
– District Stakeholder 2: (25/135.7) * 100 = 18.42 USDC (18.42%)
– Regional Stakeholder: (35.7/135.7) * 100 = 26.31 USDC (26.31%)
## 5. Stakeholder Strategies
### 5.1 Driver-Focused Staking
Drivers are incentivized to stake in the specific District cells where they operate:
– **Advantages**: Full staking power, higher reward percentage per token
– **Strategy**: Accumulate incentivized tokens from the DAO during network growth phase
– **Benefit**: Passive income in USDC stablecoin even when not actively driving
### 5.2 Investor-Focused Staking
Investors can efficiently stake across broader geographic areas:
– **Advantages**: Wider coverage, diversified exposure, less management
– **Strategy**: Stake at Regional level to cover multiple District cells
– **Benefit**: Participation in network growth across larger areas despite reduced power
### 5.3 Hybrid Approaches
Sophisticated stakeholders may employ mixed strategies:
– Concentrate stakes in high-activity Districts
– Supplement with Regional stakes for broader coverage
– Adjust stake distribution based on network activity patterns
## 6. Real-World Scenarios
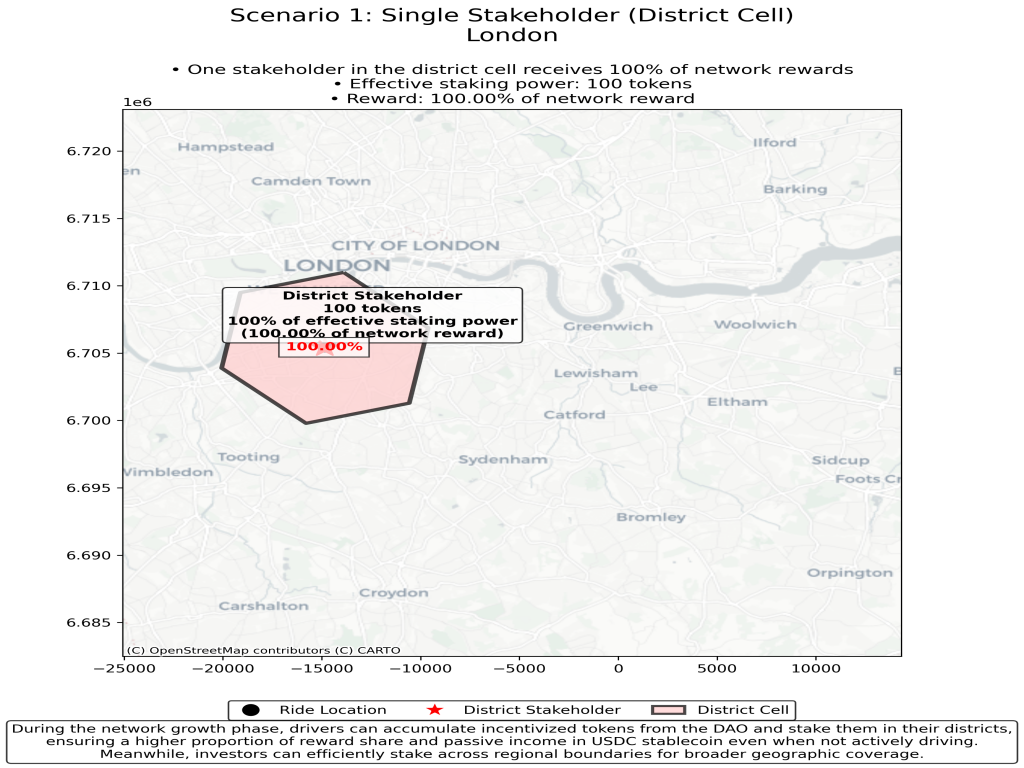
### 6.1 Scenario 1: Single District Stakeholder
**Setup:**
– One District Stakeholder with 100 tokens in a single District cell
– No Regional Stakeholders
**Outcome:**
– The District Stakeholder receives 100% of network rewards generated in that cell
– Effective stake: 100 tokens
**Real-world example:**
A driver in central London stakes 100 tokens in the Soho district. Every ride that occurs in Soho generates network rewards that go entirely to this driver. If rides generate 50 USDC in network rewards daily, the driver earns 50 USDC per day from this stake.
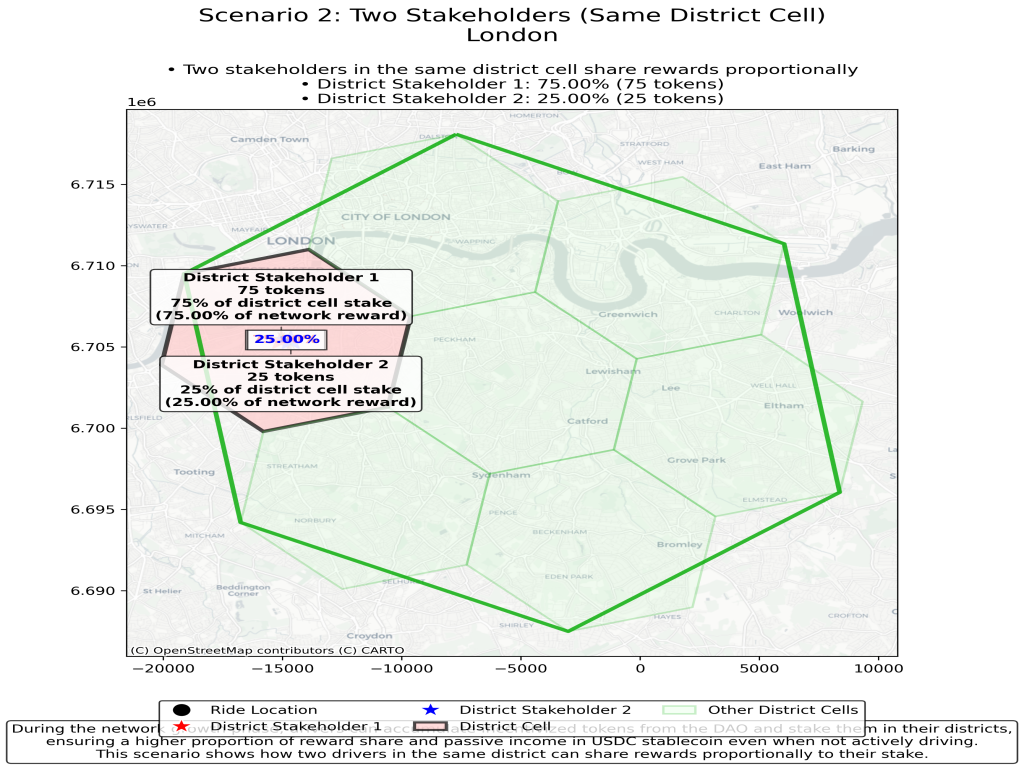
### 6.2 Scenario 2: Multiple District Stakeholders
**Setup:**
– District Stakeholder 1: 75 tokens
– District Stakeholder 2: 25 tokens
– Both staked in the same District cell
**Outcome:**
– District Stakeholder 1: 75% of network rewards
– District Stakeholder 2: 25% of network rewards
**Real-world example:**
Two drivers stake in the Westminster district of London. The first driver has staked 75 tokens, while the second has staked 25 tokens. If rides in Westminster generate 100 USDC in network rewards daily, the first driver earns 75 USDC and the second earns 25 USDC daily.
### 6.3 Scenario 3: Mixed Staking Levels
**Setup:**
– District Stakeholder 1: 75 tokens
– District Stakeholder 2: 25 tokens
– Regional Stakeholder: 250 tokens (covering the parent Regional cell)
**Outcome:**
– District Stakeholder 1: 55.27% of network rewards
– District Stakeholder 2: 18.42% of network rewards
– Regional Stakeholder: 26.31% of network rewards
**Real-world example:**
Two drivers stake in the Camden district of London (75 and 25 tokens respectively), while an investor stakes 250 tokens at the Regional level covering all of North London. For every 100 USDC in network rewards generated in Camden, the first driver receives 55.27 USDC, the second driver receives 18.42 USDC, and the investor receives 26.31 USDC.
## 7. Economic Implications
### 7.1 Network Growth Incentives
During the early growth phase, the nRide DAO can incentivize network participation by:
– Distributing tokens to active drivers based on their contribution
– Encouraging drivers to stake these tokens in their operating areas
– Creating a virtuous cycle of network growth and reward distribution
### 7.2 Passive Income Generation
The staking model creates opportunities for passive income:
– Drivers can earn network rewards even when not actively driving
– All rewards are distributed in USDC stablecoin, providing reliable income
– Staking positions can be adjusted to optimize reward potential
### 7.3 Market Dynamics
The model naturally creates market-driven coverage:
– High-demand areas will attract more stake
– Underserved areas present opportunities for higher reward percentages
– Price discovery occurs naturally through staking decisions
## 8. Technical Implementation
### 8.1 Smart Contract Architecture
The staking system is implemented through a series of smart contracts that:
– Track token stakes by H3 cell and resolution level
– Calculate effective staking power in real-time
– Distribute network rewards according to the mathematical model
– Allow stakeholders to adjust their positions as needed
### 8.2 H3 Integration
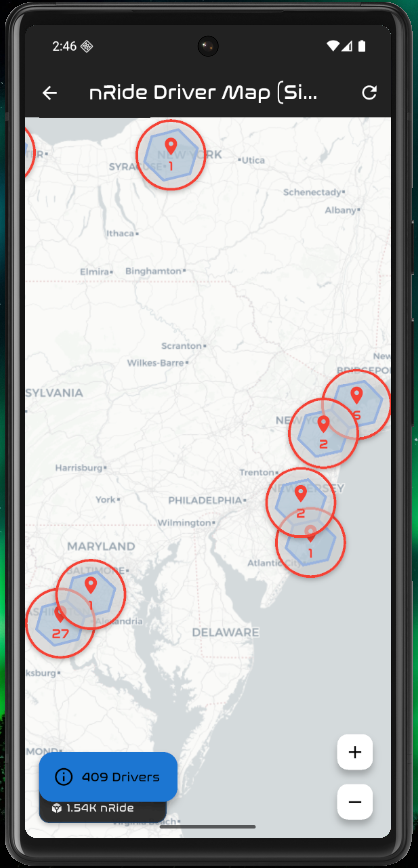
The system leverages the H3 library to:
– Convert geographic coordinates to H3 cell IDs
– Determine parent-child relationships between cells
– Calculate cell areas and boundaries
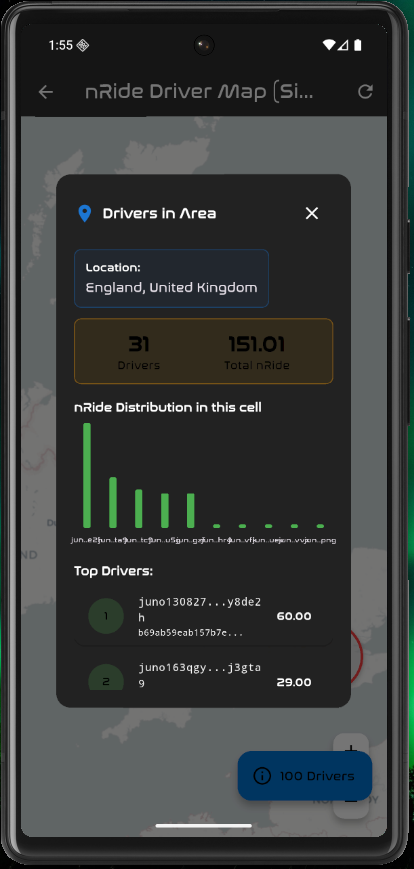
– Visualize staking coverage and network activity
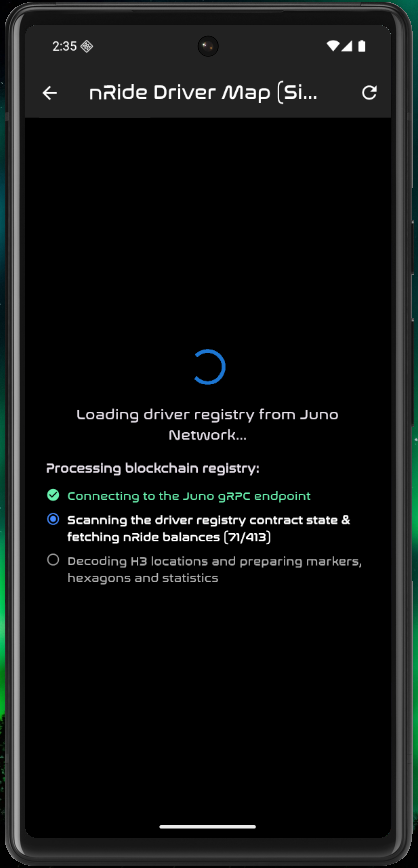
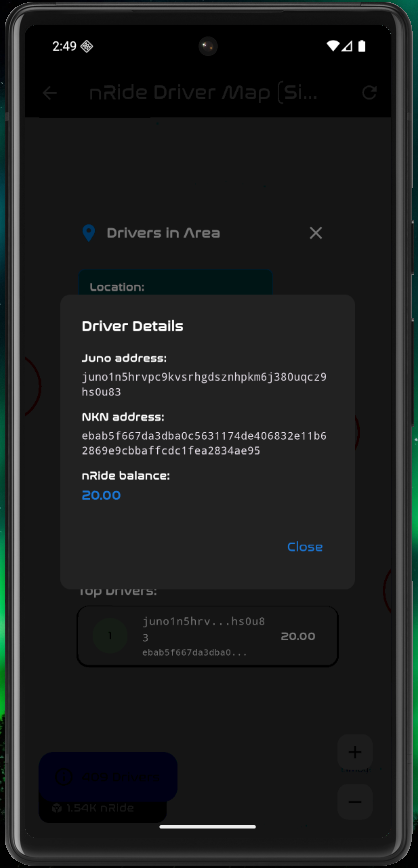
### 8.3 User Interface Considerations
The staking interface allows users to:
– View available cells on an interactive map
– See current stake distributions and reward potentials
– Place and adjust stakes with intuitive controls
– Monitor reward accrual in real-time
## 9. Conclusion
The nRide Network Rewards Model represents a significant innovation in decentralized ride-sharing economics. By leveraging the H3 hierarchical hexagonal grid and implementing a sophisticated staking power model, nRide creates a balanced ecosystem that:
– Incentivizes optimal geographic coverage
– Rewards both drivers and investors proportionally
– Creates passive income opportunities
– Scales efficiently across geographic regions
This model ensures that network value is distributed fairly to those who contribute to the network’s success, whether through active participation or capital investment, while maintaining the economic incentives necessary for sustainable growth.
—
## Appendix A: Mathematical Proofs
### A.1 Proof of Balanced Incentives
The 1/7 power reduction for Regional staking creates a balanced incentive structure where:
– District staking is exactly 7 times more powerful per token
– Regional staking covers exactly 7 times more area
– The effective stake per unit area is therefore equal
This can be proven as follows:
Let:
– S_d = Stake amount in a District cell
– S_r = Stake amount in a Regional cell
– A_d = Area of a District cell
– A_r = Area of a Regional cell
Given:
– A_r = 7 * A_d (Regional cell contains 7 District cells)
– Effective S_r = S_r / 7 (Regional stake has 1/7 power)
For equal effectiveness per unit area:
– S_d / A_d = (S_r / 7) / A_r
– S_d / A_d = (S_r / 7) / (7 * A_d)
– S_d / A_d = S_r / (49 * A_d)
– 49 * S_d = S_r
This means that to achieve the same effective stake per unit area, a Regional stakeholder would need to stake 49 times more tokens than a District stakeholder. However, since the Regional cell covers 7 times more area, the Regional stakeholder only needs 7 times more tokens to achieve the same total effective stake across the entire Regional cell.
## Appendix B: Glossary of Terms
– **H3 Cell**: A hexagonal geographic area defined by the H3 indexing system
– **Resolution**: The level of detail in the H3 grid, with higher numbers indicating smaller cells
– **District Cell**: An H3 cell at Resolution 6 (approximately 36 km²)
– **Regional Cell**: An H3 cell at Resolution 5 (approximately 253 km²)
– **Stake**: The amount of tokens committed to a specific H3 cell
– **Effective Stake**: The stake amount after applying the resolution-based power adjustment
– **Network Reward**: The portion of ride fees distributed to stakeholders
– **Staking Power**: The relative influence of a stake in determining reward distribution
Your benefits as nRide Mobility Partner
almost Instant Payment settlement to your IBAN bank account
In cooperation with Monerium, your earned ride-fees are available within your common Bank Account within seconds


Get the latest release from Google Play Store or Apple App Store


Branding
Want your own brand recognition?
If you want to be part of the global nRide network but yet want your own brand-identity preserved, get in contact with us for a white-labeled nRide rider’s client. Customizable design to match your needs- in visual appearance or special features to integrate into your own mobile application.
supported countries
Due to the nature of the H3 geospatial Database registry, a global coverage of subscriptionable service areas makes it easy to shift your transportation business into web3 with ease. Dependent on local regulations at the area you like to subscribe, you might need to KYC your valid driving license or public-transport license using a third-party zK Identity provider
supported by all major blockchains
As the sector of digital economy is thriving, the key to reach a broad audience of future passengers is to breach isolated blockchain ecosystems and focus on interoperability and an customer-first approach in UI/UX. Using the infrastructure of Noble Network, which is the emitter of CIRLCE USDC within the Interchain, nRide is accessible for any self-custodied crypto user
Conference services
nRide has been offering active ride-hailing services in cooperation with local taxi companies during several web3 & blockchain related conferences during ´23 and ’24
All feedback has been taken into account to improve the user experience for both riders and drivers. The conferences were: AwesomeWasm Berlin 2023, WebSummit 2023 Lisbon, Web3Global Media Dubai 2024, and ZenLounge Event Los Angeles 2024
unmatched blocktime
With a stunning blocktime of just 1s, the transaction handling becomes a real pleasure- no need to wait for block confirmations as you start the ride.. Almost instant transaction confirmation makes the usage of the app just as fast as usual server responses, tearing down the walls between web2 and web3